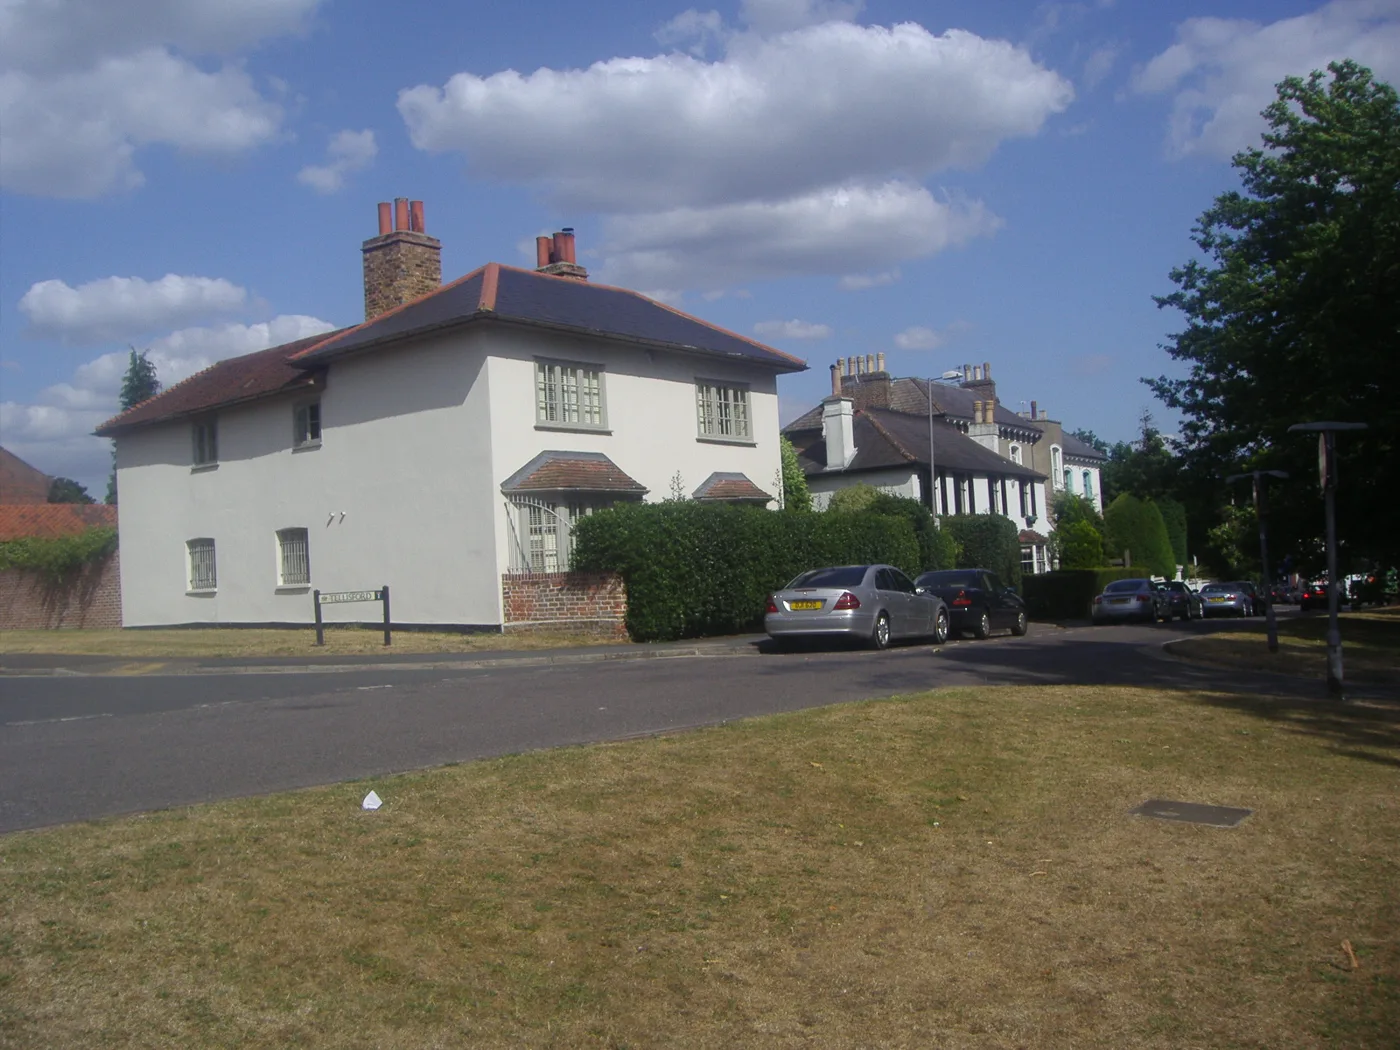

The average Elmbridge home lost £16,018 in the year to June, a 2.1% fall while England rose 1.8%. Detached homes gave up £44,536, the most of any type.
The average home in Elmbridge was worth £743,525 in June 2026, and that is £16,018 less than a year earlier. The borough fell 2.1% over the twelve months while England rose 1.8%, according to the latest Land Registry UK House Price Index.
Elmbridge is still comfortably the most expensive place in Surrey. It is going backwards anyway.
One thing to be clear about before any of these numbers are used: the UK House Price Index average is a mean, not a median. A handful of Oxshott or St George’s Hill sales drag it upward in a way that a median would not. It is a good measure of direction and a poor description of a typical home.
Detached houses took the hit
The fall was not spread evenly. Detached homes, which are the Elmbridge stock most likely to be bought by choice rather than necessity, lost more than four times what a terraced house did.
| Type | June 2026 | Change in a year | % |
|---|---|---|---|
| Detached | £1,564,668 | −£44,536 | −2.8% |
| Semi-detached | £722,021 | −£10,100 | −1.4% |
| Terraced | £576,486 | −£7,366 | −1.3% |
| Flat or maisonette | £356,229 | −£9,619 | −2.6% |
| First-time buyer | £500,171 | −£8,585 | −1.7% |
Two figures in that table are worth sitting with. A detached house in Elmbridge still averages £1,564,668, which is more than five times the England average of £293,262 for all property types. And the first-time buyer average is £500,171, so the entry point to the borough is half a million pounds even after a year of falls.
The index also splits by how people paid. Cash buyers averaged £685,151, down 2.4%. Mortgaged buyers averaged £764,608, down 2.0%. Former owner occupiers, the people moving within the market, averaged £948,215, down 2.3%.
Elmbridge against its neighbours
Surrey as a whole fell 1.2%. The South East edged up 0.3%, England rose 1.8%. So Elmbridge is underperforming its county, its region and the country. It is not, however, the worst in Surrey: Guildford and Tandridge both fell 5.6%.
| District | Average | Year to June |
|---|---|---|
| Elmbridge | £743,525 | −2.1% |
| Epsom and Ewell | £568,810 | +1.3% |
| Waverley | £560,596 | −0.8% |
| Mole Valley | £540,160 | +0.7% |
| Guildford | £523,974 | −5.6% |
| Runnymede | £489,116 | +3.5% |
| Reigate and Banstead | £480,481 | +0.4% |
| Tandridge | £475,344 | −5.6% |
| Surrey Heath | £461,396 | +6.1% |
| Woking | £433,790 | −2.7% |
| Spelthorne | £429,916 | −4.7% |
The gap at the top is the striking part. Elmbridge is £174,715 above Epsom and Ewell, the next most expensive district in the county, and £313,609 above Spelthorne, which it borders at Walton and Weybridge. Cross the river at Walton Bridge and the average drops by 42%.
Kingston upon Thames, over the boundary in London, averaged £594,498 and rose 2.9%.
Five falls in ten months, and a revision
The annual change has been negative in five of the last ten monthly releases: September 2025 (−1.9%), October 2025 (−2.3%), February 2026 (−1.8%), April 2026 (−0.7%) and now June 2026 (−2.1%). Nothing here looks like a crash. It looks like a market that has stopped moving while the rest of the country creeps up.
One caution on any figure you saw last month. The index revises earlier months with every release. May 2026 was published as £750,157 and down 0.2%; it now reads £751,672 and flat. That is a small revision, but it is the reason a single month’s number is a weak thing to argue from.
What it means for you
- If you are selling, a year of falls in a borough where the average is three quarters of a million pounds is a pricing problem, not a market collapse. The mean is dragged by the top end, and the top end is exactly where the falls are biggest.
- If you are buying, the entry point has barely moved. Terraced homes fell 1.3% and first-time buyer prices 1.7%, so the money saved is a few thousand pounds against a £500,171 average.
- If you are comparing towns, the borough average is close to useless. Land Registry sold prices put the median in Oxshott above £1.3m and the median in Walton-on-Thames near £500,000, five miles apart. Our Elmbridge house prices page has the breakdown for twelve places in the borough.
- If you are checking your own street, the index is a modelled average, not a valuation. Use the Land Registry’s own sold price data for actual transactions.
The July 2026 figures are due in Land Registry’s next monthly release.
Sources
- HM Land Registry, UK House Price Index, Elmbridge, June 2026, for the £743,525 average, the 2.1% annual fall, and the figures by property type, funding status and buyer type.
- HM Land Registry, UK House Price Index, Surrey, and the equivalent pages for each of the eleven Surrey districts, the South East, England and Kingston upon Thames, for the comparison table.
- Monthly figures for the chart are taken from the same index, Elmbridge, June 2025 to June 2026. Land Registry revises earlier months with each release; these are the values published in the June 2026 release.
More from Elmbridge News: house prices by town, council tax bands and planning news.
Have your say