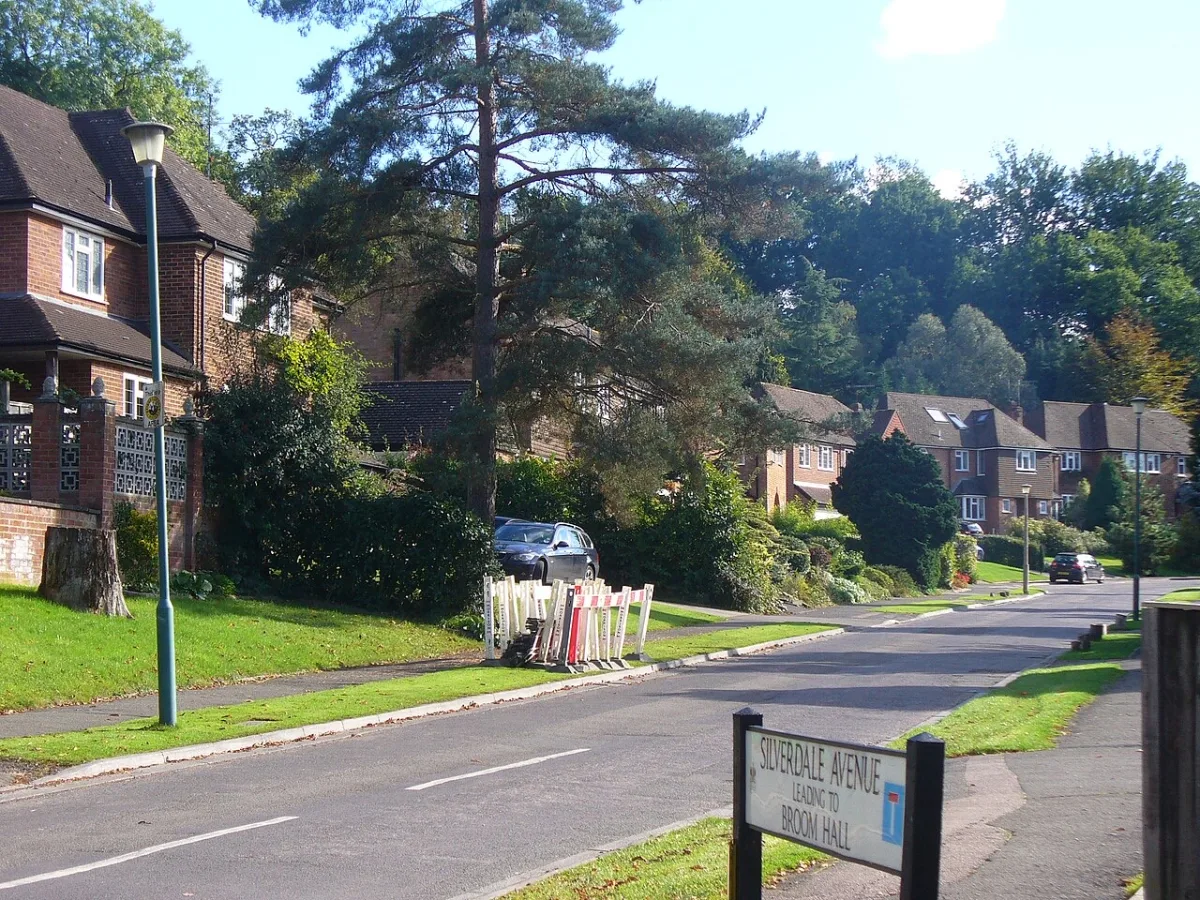

The average Elmbridge home was £748,080 in July 2026, up 1.9%. Median sold prices for 12 places, Oxshott at £1,342,500 down to Walton-on-Thames at £505,000.
The average home in Elmbridge sold for £748,080 in July 2026, the most recent month in the official UK House Price Index. That is up 1.9% over twelve months, while Surrey fell 0.4%, the South East rose 0.2% and England rose 1.1%. Elmbridge is the most expensive local authority in Surrey, and July was its strongest annual rise since July 2025.
The borough average is close to meaningless on its own, because Elmbridge is not one place. Land Registry sold prices over the last twelve months put the median in Oxshott at £1,342,500 and the median in Walton-on-Thames at £505,000. Those two are five miles apart and share a council.
The borough average, and what moved
These are the mix-adjusted figures for the Elmbridge local authority in July 2026, from the UK House Price Index, which is built from completed Land Registry sales rather than asking prices. The index is revised as more sales complete, so a recent month can move.
| Property type | Average price | Change over 12 months |
|---|---|---|
| All property types | £748,080 | +1.9% |
| Detached | £1,593,107 | +3.7% |
| Semi-detached | £725,898 | +2.6% |
| Terraced | £580,978 | +2.3% |
| Flat or maisonette | £353,544 | −1.0% |
The split has reversed since the spring. Every type rose over the year except flats, which fell 1.0%, and the biggest gain was at the top: detached houses added 3.7%, or £57,182, to reach £1,593,107. A detached house in the borough is now worth 4.5 times a flat.
The same data splits the market by buyer. A first-time buyer in Elmbridge paid an average of £501,153 in July 2026, up 1.3% on the year. Someone moving from one home to another paid an average of £955,635, up 2.2%. The gap between those two figures, near enough £455,000, is the size of the step from a first flat in Walton to a family house in Esher.
How Elmbridge compares
| Area | Average price | Annual change |
|---|---|---|
| Elmbridge | £748,080 | +1.9% |
| Surrey | £522,523 | −0.4% |
| South East | £380,878 | +0.2% |
| England | £293,479 | +1.1% |
An Elmbridge home costs about £226,000 more than the Surrey average and two and a half times the England average. The premium is not subtle, and in the year to July it widened: Elmbridge rose while the county fell.
Our monthly write-up of the latest release is at Elmbridge house prices, July 2026.
What places actually sell for
The borough average tells you nothing about your road, so here are real sold prices. HM Land Registry registered 1,769 sales in Elmbridge between 1 July 2025 and 30 June 2026. These are the median sold prices for every place with at least fifteen registered sales in that period.
| Place | Median sold price | Sales |
|---|---|---|
| Oxshott | £1,342,500 | 44 |
| Stoke d'Abernon | £1,022,500 | 16 |
| Esher | £976,500 | 162 |
| Cobham | £885,000 | 179 |
| Long Ditton | £850,000 | 43 |
| Claygate | £827,500 | 96 |
| Thames Ditton | £812,500 | 158 |
| East Molesey | £715,000 | 87 |
| Hersham | £590,000 | 150 |
| Weybridge | £560,000 | 315 |
| West Molesey | £538,625 | 136 |
| Walton-on-Thames | £505,000 | 338 |
| Hinchley Wood | £415,000 | 18 |
Three things come out of that list.
The A244 corridor is the expensive one. Oxshott, Stoke d’Abernon, Esher, Cobham and Claygate all clear £825,000. These are the wooded, low-density places on the southern side of the borough, where large detached houses on big plots dominate the sales. Oxshott alone recorded sales at £4,835,000, £4,700,000 and £4,200,000 in the twelve months. Its detached median was £2,011,500.
The river towns are the affordable ones. Walton-on-Thames at £505,000 and West Molesey at £538,625 sit below the Surrey average, in the same borough as Oxshott. Walton had 338 registered sales, the most of any place here, so this is a large and liquid market rather than a handful of trades.
Weybridge is not what its reputation suggests. Its £560,000 median is the fourth lowest in the table, and the reason is the mix: 126 of its 315 sales were flats, more than any other place in the borough. Weybridge’s detached median was £1,210,000. Both numbers are true. They describe different Weybridges.
Sold prices by property type
Using the same twelve months of Land Registry sales, the median across the whole borough was £1,300,000 for a detached house (465 sales), £725,000 for a semi-detached (439 sales), £550,000 for a terrace (367 sales) and £355,000 for a flat or maisonette (445 sales).
Those medians sit below the mix-adjusted House Price Index averages in the first table, which is normal. An average is dragged up by the largest sales; a median is not. Both are correct and they answer different questions. If you want to know what a typical home on your road changed hands for, use the median. If you want to know which way the market is moving, use the index.
Two places where the median misleads
Two of the borough’s smaller settlements produce figures that need explaining rather than quoting.
Hinchley Wood shows a median of £415,000, the lowest in the table, and that is genuinely what the middle sale was. But its eighteen sales split cleanly in two: eleven flats at Hinchley Manor and Royston Court on Manor Road North, between £100,000 and £450,000, and seven detached houses on Manor Road South, Manor Drive and Heathside, between £1,050,000 and £1,470,000. There were no sales in between. The median for a detached house in Hinchley Wood was £1,145,000.
Downside, near Cobham, is left out of the table above. Seventeen sales were registered there, but sixteen of them were at a single new development at Woodyard Mead, most of them completing on the same day in December 2025 at identical prices. That is one scheme being registered, not a village market, and a median built from it would tell you nothing about buying a house in Downside.
What this means if you are buying or selling
If you are selling, the flat borough figure hides a split: semis and terraces edged up over the year while detached houses and flats fell. If you own the sort of large detached house that Elmbridge is known for, the comparable that sold in 2022 is not the comparable now.
If you are buying, the geography matters far more than the trend. Moving your search from Claygate to Hersham, or from Esher to Walton, changes the median by £240,000 or more without leaving the borough or changing the council you pay. It is worth pricing the commute at the same time, because the stations do not line up with the prices: the annual season ticket to Waterloo is £2,492 from Thames Ditton and £3,536 from Weybridge, and the slower branch-line stations are not the cheaper ones. Whether a site near you is in the borough’s housing land supply also changes what gets built next to it.
Frequently asked questions
What is the average house price in Elmbridge?
The average home in Elmbridge sold for £748,080 in July 2026, according to the UK House Price Index built from HM Land Registry sales. Within the borough, median sold prices over the last twelve months ranged from £505,000 in Walton-on-Thames to £1,342,500 in Oxshott.
Are Elmbridge house prices going up or down?
Up, for the first time in a year. Prices rose 1.9% in the year to July 2026, while Surrey fell 0.4%, England rose 1.1% and the South East rose 0.2%. Detached houses rose 3.7%, semi-detached homes 2.6% and terraces 2.3%. Flats fell 1.0%, the only type to lose value.
Where are the most expensive houses in Elmbridge?
Oxshott, by a distance. Its median sold price over the last twelve months was £1,342,500 and its median detached sale was £2,011,500, with individual sales at £4,835,000 on Holtwood Road and £4,700,000 on Queens Drive. Stoke d’Abernon (£1,022,500) and Esher (£976,500) come next.
Where is the cheapest part of Elmbridge?
By median sold price, Walton-on-Thames at £505,000 and West Molesey at £538,625, both below the £522,523 Surrey average. Walton is also the busiest market in the borough, with 338 registered sales in twelve months.
How much is a detached house in Elmbridge?
The UK House Price Index puts the borough average for a detached house at £1,593,107 in July 2026, up 3.7% in a year. The median detached sale registered over the last twelve months was £1,300,000.
Why do Rightmove and Zoopla show different figures?
They usually cover a different area and a different property mix. A “Weybridge” or “Esher” average on a property portal is often weighted toward larger houses in the town postcode. The figures on this page are for the whole Elmbridge local authority, which runs from Thames Ditton to Cobham and includes both Oxshott and West Molesey.
Where can I check what one specific house sold for?
Every completed sale in England and Wales is public. Search a street or an address free on the HM Land Registry Price Paid service.
Sources
- UK House Price Index, Elmbridge (HM Land Registry) for the borough averages, property-type figures and buyer-type figures, checked 21 September 2026.
- UK House Price Index, Surrey, South East and England for the comparison table.
- HM Land Registry Price Paid data for the 1,769 registered sales behind the place-by-place and property-type medians. Sales are filtered to those the Land Registry records in the Elmbridge district, which matters here because five of the borough’s six postcode areas also cover a neighbouring council.
- HM Land Registry Price Paid search to look up an individual address.
Land Registry figures are provisional and revised as sales complete and are registered, so the most recent months in the sold-price sample are still filling up. Checked on 10 August 2026.
More Elmbridge local information: trains to London, roadworks and travel, planning news and things to do in Elmbridge.
Have your say